Operational Definition of the Problem
Content and campaign performance on digital channels depends as much on 'what is shared' as it does on 'when, to whom, and in what region' it is shared. When a sharing plan is executed without considering the hour/period/city breakdown, performance variation occurs with the same budget and same content.
This situation leads to fluctuations in reach, engagement, and order conversion, errors in resource planning in marketing operations, and reporting disputes. The uncertainty that needs to be managed is the inability to tie timing, target audience, and geographic distribution to a measurable decision set.
Why Was This Analysis Conducted?
Intuitive sharing times and 'general audience' targeting produce the following operational risks:
- Peak load windows are missed, the same content is consumed during low demand hours.
- Campaign resources are scaled incorrectly, budget and team effort are distributed to inefficient hours.
- When regional demand concentration is not taken into account, content/offer mismatch increases.
- If demographic composition is not visible, the message language and creative format standard are corrupted.
Therefore, with an engineering approach, a need arose for a decision-oriented dashboard that consolidates time, day, city, and demographic breakdowns on a single screen.
Engineering Approach / Methodology Used
Within the scope of the study, a scenario logic was constructed based on the following assumptions and parameters:
Assumptions
- Order volume is sensitive to sharing/activity timing.
- Day and hour breakdowns represent the operational rhythm, user behavior, and traffic density.
- City breakdown is decisive for logistics/delivery expectations and local campaign response.
Parameters
- Order density based on time zone (peak hour, low hour)
- Order distribution by day (weekly rhythm, peak day, weak day)
- Order weight and demographic composition by city (gender and age)
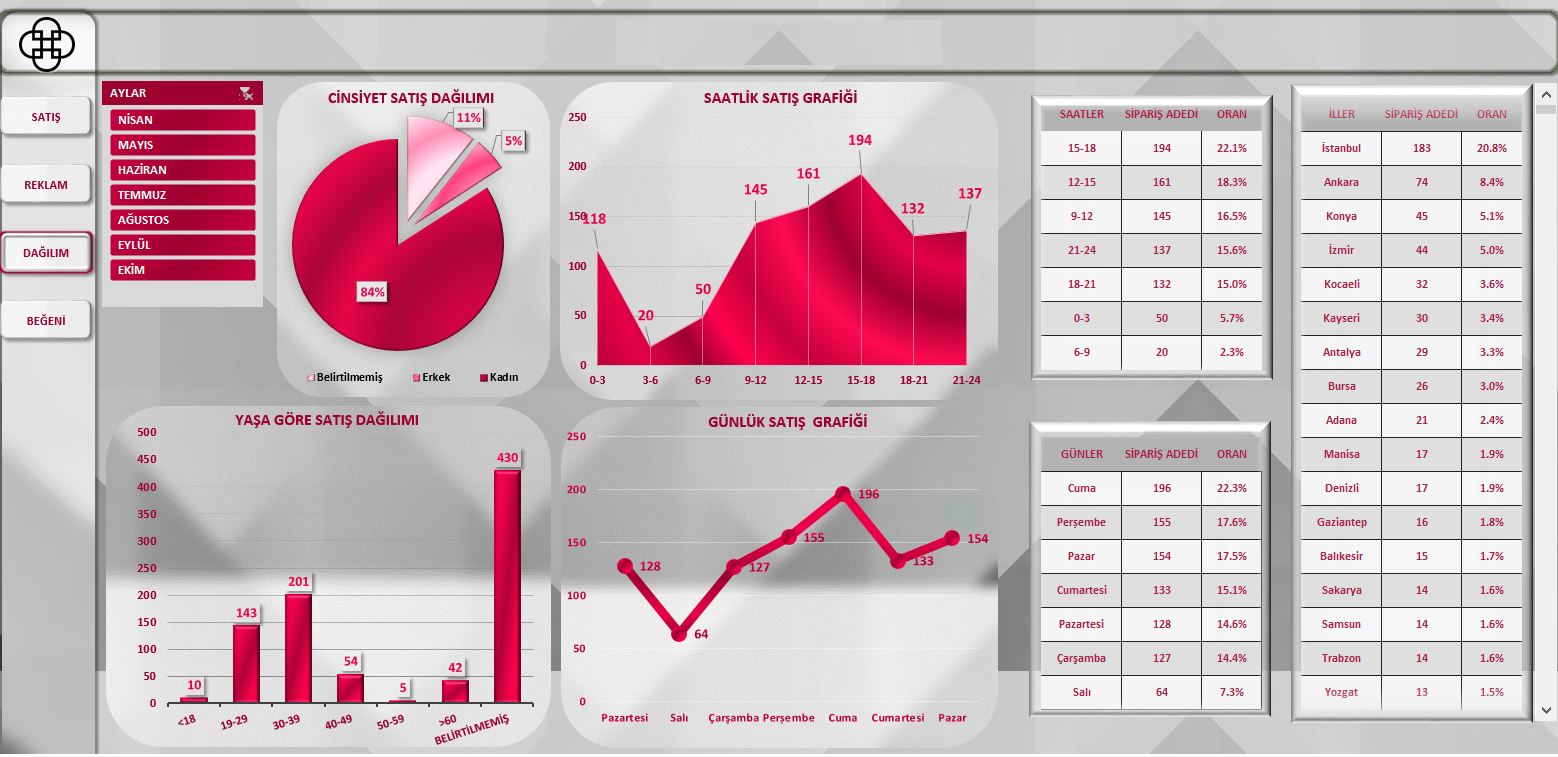
Managerial Interpretation of Findings
The dashboard carries operational decision making to a 'single screen' logic. When timing, targeting, and geographic distribution become trackable on the same table, marketing operations evolve from a reporting activity into a process management discipline.
Peak Hours
Made Visible
100%
Trackable Decision Set
Opportunities: A standard of conversion-oriented content during peak hours and community-oriented content during low hours has become applicable. Additionally, standardization of creative sets according to demographic composition has been ensured.
Corporate and Operational Achievements
- Standardization: Sharing hours and days, including seasonality, are tied to standard decision rules.
- Traceability: Performance differences based on hour/day/city/demographics can be audited on a single screen.
- Capacity Security: Content production and publishing operations are planned according to peak windows.
- Cost Control: Budget leakage in low-performance windows is reduced.
Conclusion - Consulting Perspective
This screen elevates sharing and campaign management from the level of 'producing content' to the level of 'managing operational decisions'. By gathering hour-day-city-demographic breakdowns within the same decision framework, peak load windows, regional priorities, and target audience composition become visible. Ultimately, the marketing budget and effort are managed not intuitively, but with a data-driven and standardized logic.